

In this blog, we are focusing on intervertebral discs. While muscles are the spine’s dynamic support envelope, like the guywires and control lines that steady a moving mast, the intervertebral discs are the spine’s “couplers” between vertebrae: fibrocartilaginous load absorbing cushions that connect adjacent bones and permit controlled motion.
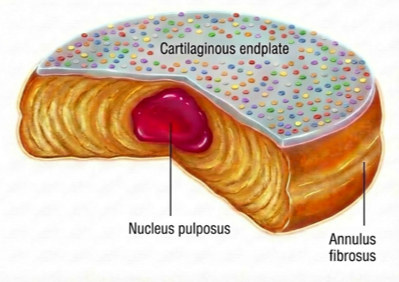
In a healthy disc, the center behaves like a water-loaded hydraulic core, like the “jelly” in a jelly donut, a sealed pressure chamber whose water-binding matrix maintains hydration so forces can be distributed smoothly under compression. Around it sits a fiber-wound restraint layer, like braided composite wrapping, designed to resist tensile and twisting loads. And the disc–bone interface is like the donut’s wafer-thin top and bottom bases: load-bearing caps that also serve as the porous diffusion gateway to “fuel” a tissue with minimal direct blood supply [1,2].
What is an intervertebral disc?
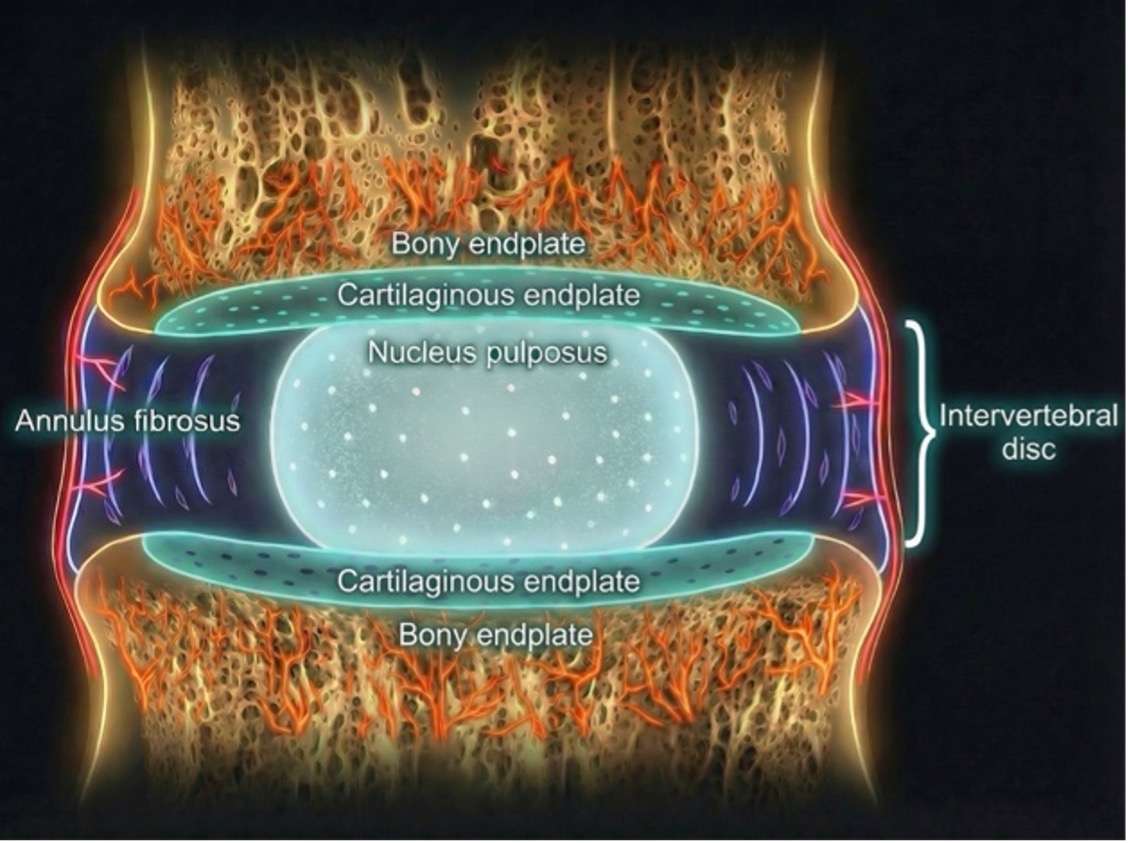
The intervertebral disc is a three-part structure designed to distribute force and permit motion: The annulus fibrosus (lamellar collagen ring), the nucleus pulposus (hydrated proteoglycan-rich core), and the cartilaginous endplates (the interface to bone). The nucleus pulposus’ high proteoglycan/water content supports compressive loading. The annulus fibrosus’ organized collagen lamellae resists tensile and torsional forces. And the cartilaginous endplate must be strong enough for load yet porous enough for diffusion-based nutrition into the avascular disc.
A key practical implication: the disc is nutritionally fragile. It is largely avascular, and disc cells depend on diffusion through the endplate and outer annulus fibrosus. When endplates calcify or degenerate, transport worsens, creating a biological “bottleneck” that can accelerate disc cell stress and degeneration [1,2].
Why disc degeneration matters (beyond “wear-and-tear”)
Disc degeneration is a chain reaction that begins with biochemical breakdown, becomes structural failure, and ultimately spreads into a motion‑segment problem. It can start with early shifts in the cells and building blocks of the disc, then move into a phase where the disc makes and maintains less of the water-holding matrix. As that water-binding structure breaks down, the disc becomes less hydrated, its internal support weakens, and it becomes more vulnerable to loss of height and mechanical failure under everyday loading. Over time, this isn’t just a shape problem, it’s a change in the disc’s internal chemistry and structure that can set the stage for pain [4].
How degeneration can become painful
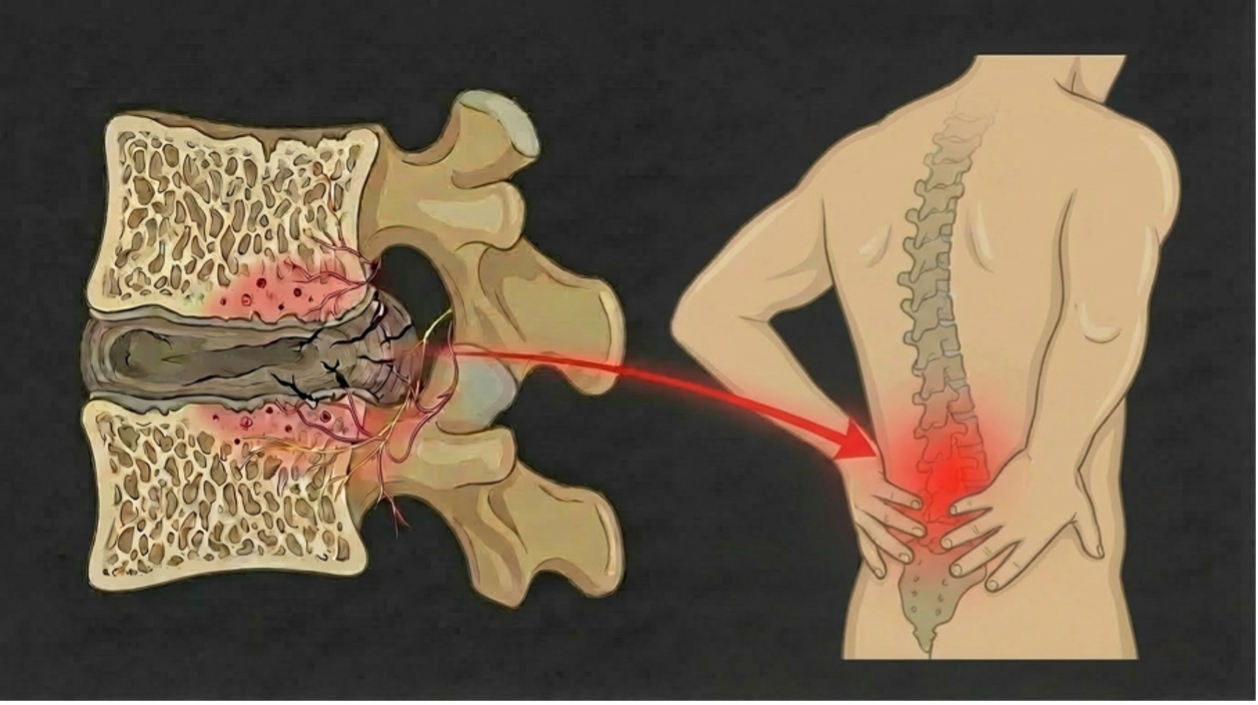
A healthy disc is not deeply wired for pain: nerve supply is mostly limited to the outer annulus fibrosus. Degeneration can change that boundary. When annular tears/fissures form, they create “paths” for vascularized granulation tissue to grow inward, and nerves can follow that same route, reaching deeper into disc tissue where they normally aren’t present, even extending toward the nucleus pulposus in the middle. Once nerves are present deeper inside, inflammation can make them more sensitive and reactive, so normal movement and loading is more likely to trigger pain signals. The endplates can add a second pain pathway: as the disc–endplate region becomes involved, nerve innervation has been observed in vertebral endplates in discogenic low back pain patients with Modic changes, supporting the idea that pain can be generated not only “inside the disc,” but also at the disc–endplate interface as part of a broader motion-segment process [4,5].
The “classic” grading approach: Pfirrmann (and its built-in limitation)
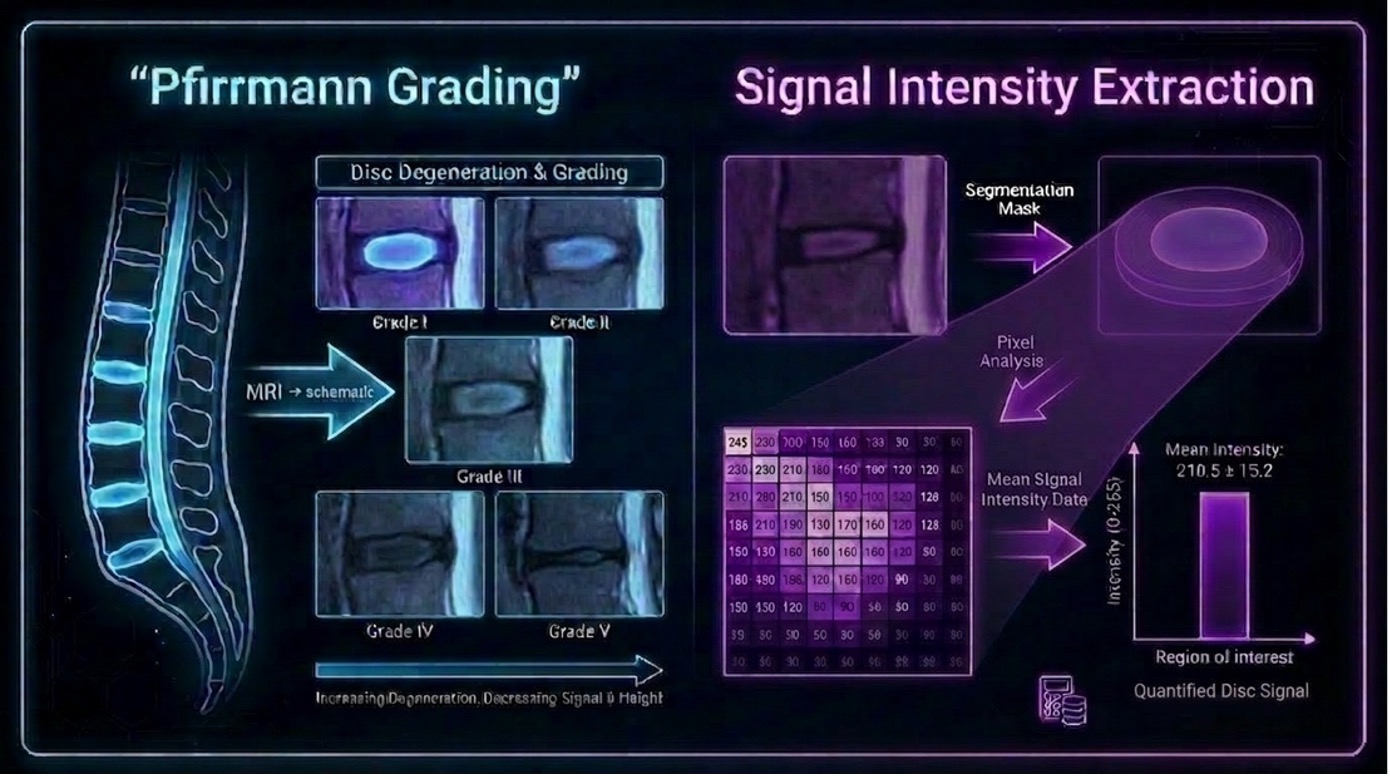
The Pfirrmann grading system is widely used to classify lumbar disc degeneration using a 5-grade ordinal scale based on disc structure, signal intensity, annulus / nucleus distinction, and disc height on MRI. It is useful and familiar, but it is also inherently categorical and depends on visual interpretation, which can limit granularity when you want to detect subtle change or model risk factors continuously [6,7].
Disc signal intensity index: Making disc degeneration measurable
The disc signal intensity index (aka DSI2) turns the disc’s T2w signal intensity on a midsagittal MRI into a continuous number, normalized to cerebrospinal fluid, to quantify disc degeneration.
What does “T2w” mean: A T2‑weighted MRI is an MR image type designed so that water-containing tissues look bright. In the spine, cerebrospinal fluid is bright on T2w images because it is essentially fluid. A healthier, more hydrated disc (especially the nucleus pulposus) also tends to look brighter than a dehydrated/degenerating disc, so T2w “brightness” becomes a practical visual proxy for hydration-related degeneration.
The disc signal index samples signal in the disc at three locations (anterior 1/3, middle, posterior 1/3) and divides the extracted signal intensity by a cerebrospinal fluid reference region of interest, so the output is more comparable than raw brightness alone. That makes it advantageous versus Pfirrmann because it produces a more objective, continuous value (less reader-dependent than an ordinal visual grade), which can better capture subtle differences and small changes over time.
Why DSI2 may be a great imaging biomarker for disc research and future surgical decision making
DSI2 converts the qualitative observation that a “disc looks dark” into a standardized, repeatable, continuous metric that can be compared across discs and patients and then linked to clinically relevant factors like symptoms and comorbidity risk [7–9].
- DSI2 is more objective than Pfirrmann grading and provides a continuous measure, which is better suited for defining thresholds and building risk models than a five-level grade. It produces a numeric value that can be trended, stratified, and modeled rather than relying on reader-dependent category jumps [7]
- It correlates with patient quality of life in a symptomatic lumbar spine cohort, whereas Pfirrmann grading does not [7]
- DSI2 demonstrates repeatability. In the cervical spine, it showed excellent reliability between different readers and when measurements were repeated by the same reader [9]
- It supports longitudinal risk-factor discovery: In a large lumbar longitudinal dataset (325 patients, 1,439 discs; MRIs ≥3 years apart), older age (p=.030) and congestive heart failure (CHF) (p<.001) were independent risk factors for degenerative progression using DSI2 [8]
Take-home message
Discs don’t degenerate in categories. Why should our metrics?
DSI2 provides a more objective way to assess disc degeneration and link it to patient outcomes and risk factors, helping move disc assessment from the more subjective “graded appearance” toward measurable risk and trajectory. In the future, it may also help assess how the level of disc degeneration contributes to surgical outcomes.
References
[1] Mohd Isa IL, Teoh SL, Mohd Nor NH, Mokhtar SA. Discogenic Low Back Pain: Anatomy, Pathophysiology and Treatments of Intervertebral Disc Degeneration. Int J Mol Sci 2023;24. https://doi.org/10.3390/ijms24010208.
[2] Raj PP. Intervertebral Disc: Anatomy‐Physiology‐Pathophysiology‐Treatment. Pain Practice 2008;8:18–44. https://doi.org/10.1111/j.1533-2500.2007.00171.x.
[3] Wong J, Sampson SL, Bell-Briones H, Ouyang A, Lazar AA, Lotz JC, Fields AJ. Nutrient supply and nucleus pulposus cell function: effects of the transport properties of the cartilage endplate and potential implications for intradiscal biologic therapy. Osteoarthritis Cartilage 2019;27:956–64. https://doi.org/10.1016/j.joca.2019.01.013.
[4] Lyu FJ, Cui H, Pan H, MC Cheung K, Cao X, Iatridis JC, Zheng Z. Painful intervertebral disc degeneration and inflammation: from laboratory evidence to clinical interventions. Bone Res 2021;9. https://doi.org/10.1038/s41413-020-00125-x.
[5] Lotz JC, Fields AJ, Liebenberg EC. The Role of the Vertebral End Plate in Low Back Pain. Global Spine J 2013;3:153–63. https://doi.org/10.1055/s-0033-1347298.
[6] Pfirrmann CWA, Metzdorf A, Zanetti M, Hodler J, Boos N. Magnetic Resonance Classification of Lumbar Intervertebral Disc Degeneration. Spine (Phila Pa 1976) 2001;26:1873–8. https://doi.org/10.1097/00007632-200109010-00011.
[7] Tsuchiya K, Okano I, Kobayashi R, Dodo Y, Ogawa J, Hara E, Taketomi A, Kudo Y. Quantitative Assessment of Intervertebral Disc Degeneration Using the Disc Signal Intensity Index in Patients With Spine-Related Pain. Cureus 2024. https://doi.org/10.7759/cureus.63553.
[8] Tsuchiya K, Okano I, Guven AE, Köhli P, Hambrecht J, Evangelisti G, Chiapparelli E, Burkhard MD, Shue J, Girardi FP, Cammisa FP, Sama AA, Hughes AP. Risk factors for progression of nucleus pulposus degeneration in the lumbar intervertebral disc: a retrospective analysis using the disc signal intensity index. The Spine Journal 2025;25:1466–73. https://doi.org/10.1016/j.spinee.2025.01.036.
[9] Tsuchiya K, Okano I, Guven AE, Verna B, Köhli P, Hambrecht J, Evangelisti G, Chiapparelli E, Burkhard MD, Tripathi V, Shue J, Girardi FP, Cammisa FP, Sama AA, Hughes AP. Quantitative assessment of cervical disc degeneration using disc signal intensity index. The Spine Journal 2025;25:903–10. https://doi.org/10.1016/j.spinee.2024.11.017.