
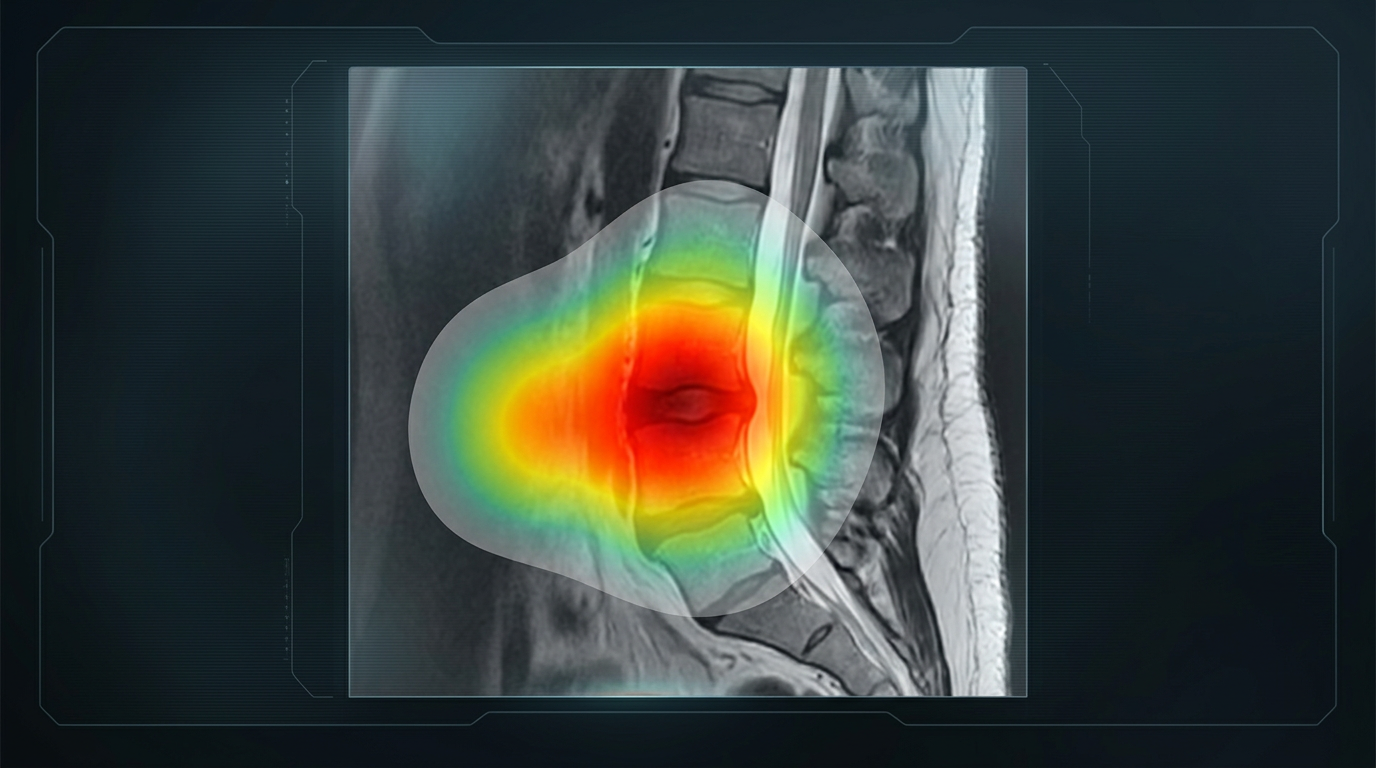
The most persistent criticism of AI is that nobody can explain how it reaches an answer. A neural network holds millions of numerical parameters, and no single one of them corresponds to anything a person would recognize as a reason. The system produces an output, and the mechanism that produced it is not written down anywhere a human can read.
In most industries this is tolerable. In medicine it is not, because the reasoning carries as much weight as the conclusion. A surgeon who cannot examine why a recommendation was made cannot judge whether it applies to the patient in front of them, cannot detect when the system is wrong, and cannot defend the decision afterward.
Opacity and Bias
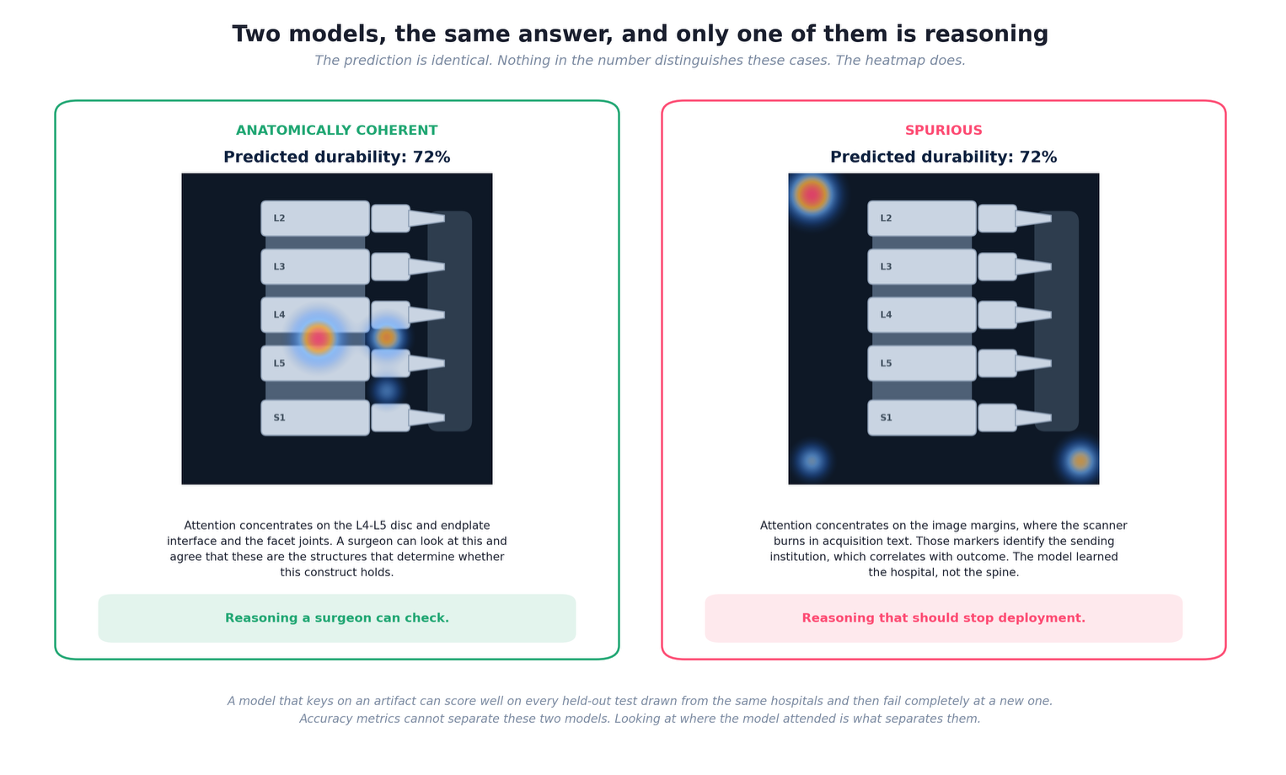
Opacity also conceals bias. A model learns whatever pattern in the training data predicts the outcome, and it does not distinguish between causal anatomy and incidental correlation. If sicker patients at one institution were imaged on a particular scanner, the model can learn the scanner. If a marker burned into the image margin identifies the referring hospital, and that hospital serves a population with worse outcomes, the model can learn the marker.
These models perform well in validation, because the test data carries the same shortcuts as the training data. They fail at a new institution where the shortcut no longer holds, and they fail unevenly, with the largest errors falling on whichever population the proxy encoded. Accuracy metrics cannot detect any of this. The prediction looks the same whether the model examined the anatomy or the acquisition text.
What a Heatmap Actually Measures
An attention heatmap addresses this directly. To build one, the model divides an imaging study into small patches and processes each of them. As it works toward an answer, it assigns every patch a weight representing how much that patch influenced the result. Weights across the image sum to one, so a patch holding a large share of the total did most of the work.
Rendering those weights as color produces the heatmap. Bright regions carried heavy influence. Dark regions were effectively ignored. Placed over the original study, the map shows where in the anatomy the model concentrated its reasoning, and a clinician can evaluate whether those structures are the ones that ought to matter.
One distinction matters and is regularly missed. A weight measures magnitude of influence, not direction. A bright region at the disc and endplate interface means the model relied heavily on what it found there. It does not indicate whether what it found raised or lowered the prediction. Dense bone and a competent endplate produce a high weight because they support the construct. Severe facet arthropathy produces an equally high weight because it undermines the construct. The two appear identical on the map.
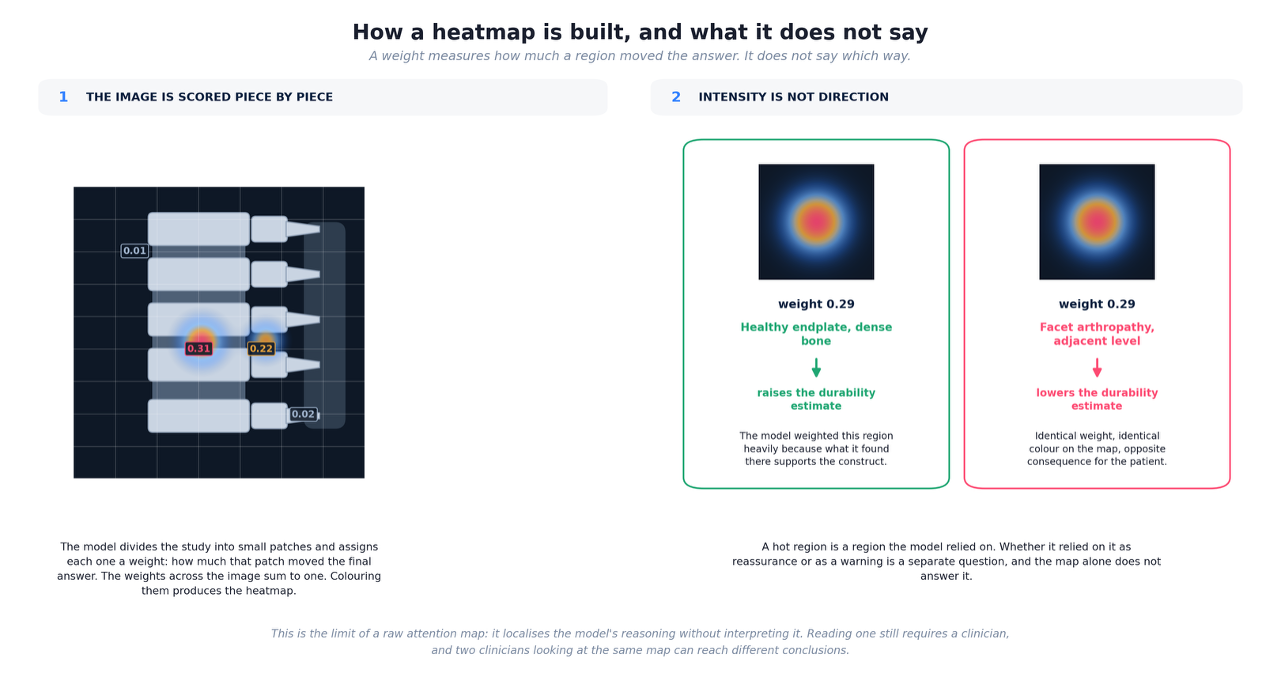
This is the honest limit of a raw attention map. It localizes reasoning without interpreting it. Two clinicians reading the same map can reach different conclusions about what it means, which leaves the interpretation exactly as practitioner-dependent as the imaging review it was meant to support.
What SDI Built on Top of the Map
Surgeon Decision Intelligence treats the attention map as an intermediate result rather than a finished explanation. A durability model analyzes the imaging and produces both a prediction and an attention map identifying the regions that drove it: facet joints, the disc and endplate interface, the pedicle and fixation corridor, adjacent level anatomy, and the surrounding muscle and ligament.
A second model then reads that map. Rather than evaluating each highlighted region in isolation, it examines how the regions relate to one another, because co-activation carries information no single region carries alone. The platform distinguishes a local pattern, where elevated weights concentrate at one site and imply a discrete structural deficiency, from a distributed pattern, where weights span separated but biomechanically linked structures and imply a load transfer problem. It maps those interaction patterns onto named failure mechanisms, then triggers the specific measurements that mechanism requires and identifies which contributing factors the surgeon can change.
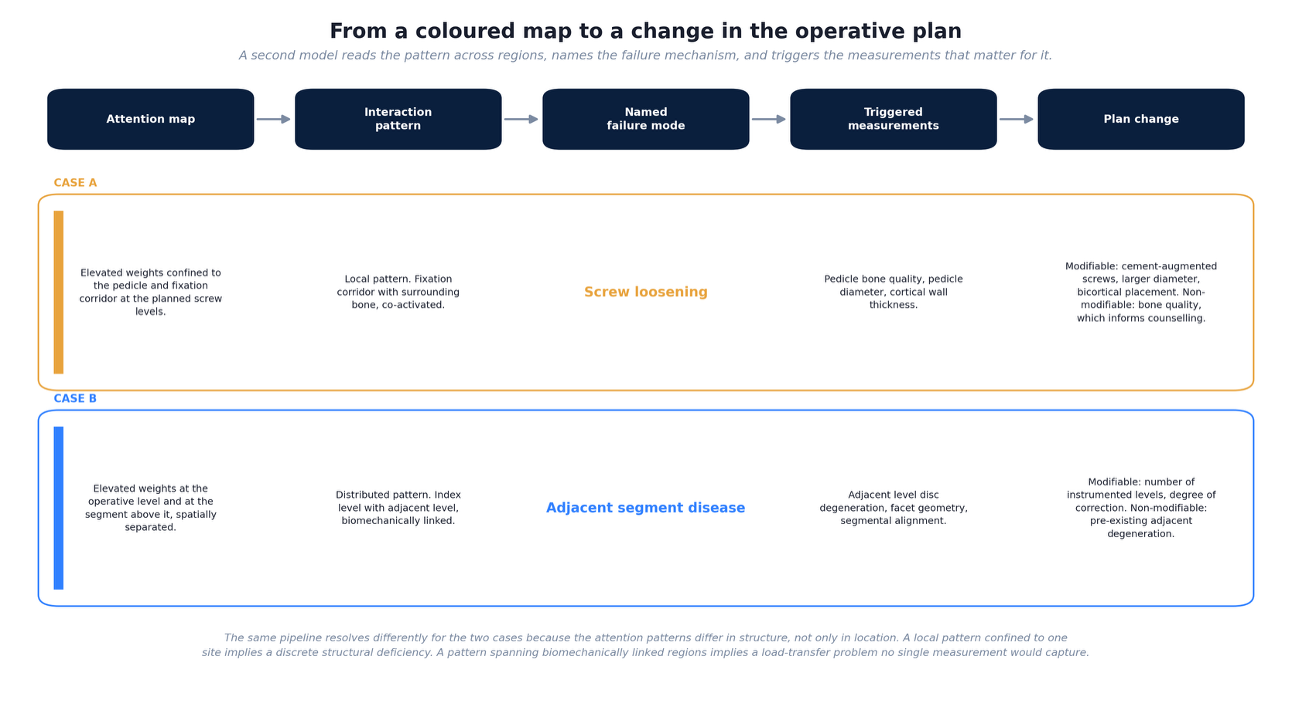
Consider two cases. In the first, elevated attention concentrates on the pedicle and fixation corridor at the planned screw levels, co-activated with the surrounding bone. The platform reads this as a local pattern, predicts screw loosening, and triggers measurement of pedicle bone quality, pedicle diameter, and cortical wall thickness. It then separates what the surgeon controls from what they do not: cement augmentation, larger diameter screws, or bicortical placement are modifiable, while the underlying bone quality is not, and belongs in the preoperative counseling conversation.
In the second, attention appears at the operative level and again at the segment above it. The platform reads this as a distributed pattern, predicts adjacent segment disease, and triggers measurement of adjacent level disc degeneration, facet geometry, and segmental alignment. The modifiable factors here are different in kind: the number of instrumented levels and the degree of correction. Pre-existing degeneration at the adjacent level is not modifiable and again informs counseling rather than technique.
The same colored map produces different guidance in each case because the structure of the pattern differs, not merely its location.
Conclusion
A heatmap converts an opaque score into something a surgeon can inspect, and that alone rules out a class of failures that accuracy metrics cannot detect. It does not, on its own, say what the highlighted anatomy means. Closing that gap requires converting the map into named mechanisms, specific measurements, and a clear division between what can be changed and what must be discussed. Explainability is worth having when it changes what the surgeon does.