
The Problem: Too Much Data, Not Enough Answers
Imagine a hospital with thousands of spine MRI scans stored in its database. Each scan shows detailed images of a patient's spine—every vertebra, every disc, every curve. Doctors know that somewhere in this massive collection of data lies valuable information. Past patients with similar spines probably had similar outcomes after surgery. If doctors could find those matches, they could predict what will happen to new patients before they even enter the operating room.
But here's the challenge: modern MRI scans contain millions of individual data points. A single spine MRI can generate over 15,000 images, each packed with information about bone density, disc height, tissue quality, and spinal alignment. Multiply that by thousands of patients, and you face an overwhelming flood of data. Traditional analysis methods simply cannot handle this volume effectively. Even powerful computers struggle to find meaningful patterns when every patient's spine looks different—different sizes, different shapes, different proportions.
Big Data Meets Bigger Challenges
You might think that big data analysis tools could solve this problem. After all, we use artificial intelligence and machine learning to analyze complex datasets in many other fields. However, spine MRIs present a unique obstacle that makes standard analysis nearly impossible.
The core issue lies in comparison. How do you compare a teenager's small spine to an adult's large spine? How do you match a 5-foot-2 patient's MRI to a 6-foot-4 patient's scan? The absolute measurements differ dramatically. A vertebra that measures 25 millimeters in one patient might measure 35 millimeters in another. The spacing between discs varies. The overall spine length changes. These differences make direct pixel-by-pixel comparisons useless.
Even worse, each MRI scanner produces slightly different image qualities. One hospital's scanner might capture images at 1-millimeter resolution while another uses 1.5-millimeter resolution. This inconsistency adds another layer of complexity to an already difficult problem.
Without a way to standardize these comparisons, those millions of MRI scans remain isolated data points rather than a connected knowledge base. The insights remain locked away.
Enter Proportional Array Voxel Matching
This is where Proportional Array Voxel Matching changes everything. Let's break down this four-word phrase to understand exactly what it means:
Voxel: Think of a voxel as a 3D pixel. While a regular pixel represents a flat square on your screen, a voxel represents a cube of space in three dimensions. In medical imaging, each voxel captures information about a specific tiny volume of tissue—its density, its type, its characteristics. A spine MRI consists of millions of these voxels stacked together to form a complete 3D picture.
Array: An array simply means an organized collection. In this context, it refers to all those voxels arranged in a structured grid pattern. The array creates a coordinate system where every voxel has a specific position—like addresses on a street map, but in three dimensions.
Proportional: This is the key word that makes everything work. Proportional means we scale things relative to their size rather than using absolute measurements. Instead of saying "this disc is 8 millimeters tall," we say "this disc occupies 12% of the spine's height at this location." This scaling allows us to compare different-sized spines on equal terms.
Matching: Finally, matching refers to the process of comparing these proportional voxel arrays to find similar patterns across different patients. The system looks for spines that share the same relative characteristics, even if their absolute sizes differ dramatically.
Understanding Through Apartments
Let's use a real estate analogy to make this clearer. Imagine you own a real estate company with data on 10,000 apartments, including their sale prices and rental histories. A new apartment comes on the market, and you want to predict its value.
The challenge? Apartments vary wildly in size. Some measure 600 square feet while others span 2,500 square feet. You cannot simply compare them room-by-room because they have different numbers of rooms and different layouts.
Here's where Proportional Array Voxel Matching helps. You divide every apartment—regardless of size—into the same standardized 10×10×10 grid of cubes (voxels). Now a tiny studio and a spacious three-bedroom both fit into exactly 1,000 voxels. The difference is that each voxel in the studio represents a smaller actual space than each voxel in the larger apartment.
Next, you color-code each voxel by room type: kitchens appear red, bedrooms blue, bathrooms green, living rooms yellow. Now you can compare the proportional layouts. You might discover that both apartments have their kitchen voxels in the bottom-left quadrant, master bedroom voxels in the top-right, and bathroom voxels clustered in the center.
.jpeg)
This apartment on the left shows a 1,200 sq ft property, while the one on the right spans 3,500 sq ft. Despite their size difference, the Proportional Array Voxel Matching system divides both into identical grids and identifies their similar proportional layouts. The system finds that both kitchens occupy roughly the same relative position, both master bedrooms sit in similar locations, and both share comparable flow patterns—even though the actual room sizes differ dramatically.
Why This Matters for Apartments
This proportional matching system lets you find apartments with similar layouts regardless of their absolute size. You discover that certain layout patterns correlate with higher prices. Maybe apartments with kitchens in specific proportional positions rent faster. Perhaps certain bathroom placements increase property values.
Most importantly, when that new apartment hits the market, you can instantly compare its proportional voxel pattern against your entire database. The system finds the 50 most similar apartments and uses their actual sale prices to predict what this new property will fetch. The prediction accounts for layout quality, not just square footage.
Applying This to Spine MRIs
Now let's apply this same concept to spine imaging. The image below shows how this works in medical practice.
.jpeg)
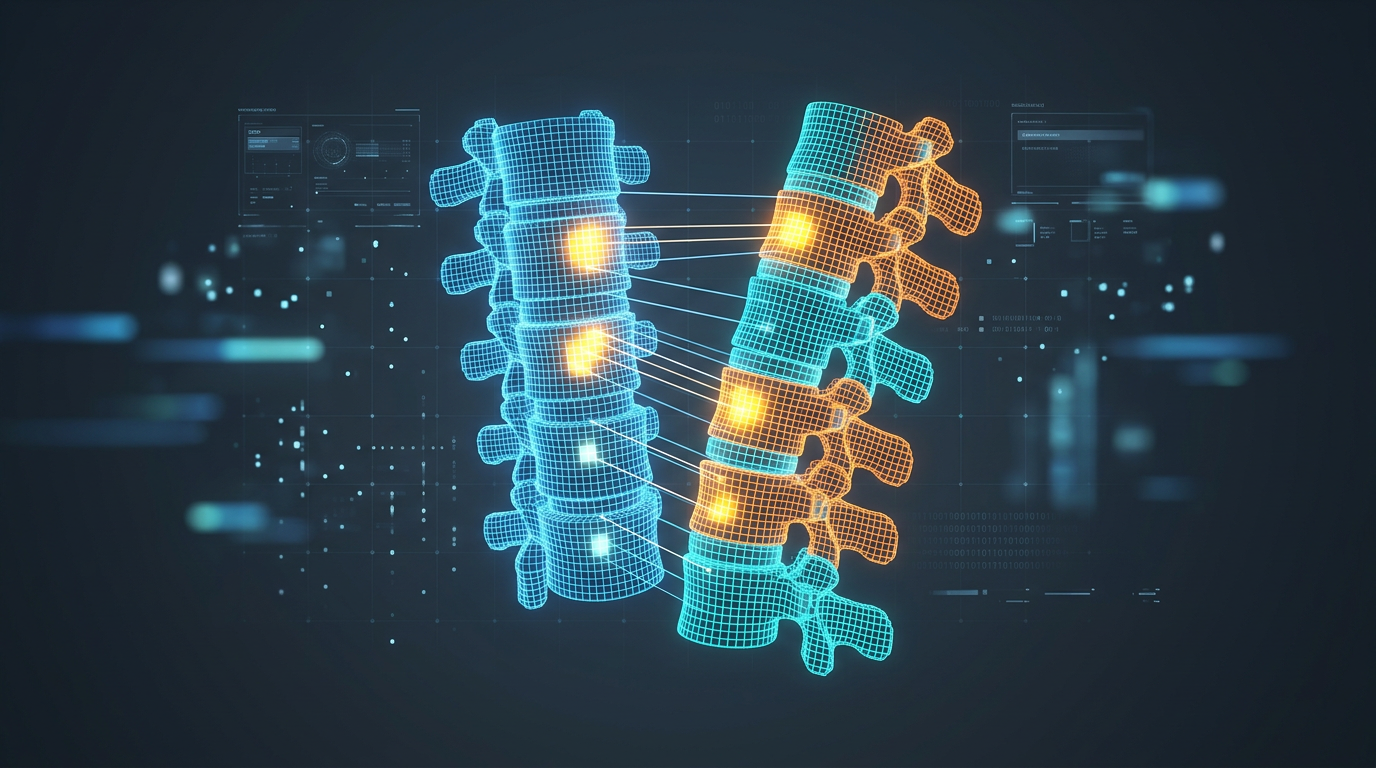
On the left, you see two patients with dramatically different spine sizes—a teenager measuring 150 centimeters tall and an adult at 190 centimeters. Their MRI scans show spines of completely different scales. Traditional analysis cannot directly compare these scans because every measurement differs.
In the center panel, both spines get overlaid with identical standardized voxel grids—let's say 50×50×100 voxels. Each voxel gets color-coded by tissue type: bone appears white, intervertebral discs show blue, the spinal cord glows yellow, and surrounding tissue displays pink. Now both spines exist in the same proportional framework despite their size difference.
The right panel shows the proportional matching. The system compares both patients' voxel patterns against a historical database of thousands of previous patients. It finds matches—patients whose spines showed similar proportional characteristics. The system identifies that Patient A's voxel pattern matches 1,000 historical cases with 87% similarity. More importantly, it knows what happened to those 1,000 patients after various treatments.
Another challenge is that different MRI machines can make the same tissue look brighter or darker, even when nothing about the patient has changed. Also, where a patient lies inside the scanner can create a bias field effect, which is a smooth “shading” across the image (for example, one side of the scan looks slightly brighter than the other), and that can change voxel values in a way that has nothing to do with real anatomy. A proportionally matched model helps by learning these common scanner and shading differences from several images, so the system can adjust for them and keep voxel matching consistent across machines.
Predicting Patient Outcomes
This matching capability transforms spine surgery planning. When a new patient needs surgery, doctors can use Proportional Array Voxel Matching to search through thousands of previous cases. The system finds patients with similar proportional spine characteristics—similar disc height ratios, similar curvature patterns, similar bone density distributions.
Then it reveals what happened to those similar patients after different surgical approaches. Maybe 15 patients with this spine pattern underwent spinal fusion surgery, and 12 of them reported excellent outcomes while 3 experienced complications. Perhaps 8 other similar patients chose disc replacement surgery, with different success rates.
This information gives doctors evidence-based predictions specific to each patient's unique anatomy. Instead of relying solely on general statistics or their personal experience, surgeons access a vast library of relevant cases that match their patient's proportional spine characteristics.
Beyond Clinical Trials: Virtual Surgery Simulation
Here's where this technology becomes truly revolutionary: doctors no longer need to run expensive, time-consuming clinical trials for every surgical variation. Traditional clinical trials might take years and involve hundreds of patients to determine whether a new surgical technique works better than existing approaches.
Proportional Array Voxel Matching offers an alternative. Doctors can create a predictive twin—a computer model of a specific patient's spine based on their MRI voxel data. Then they can virtually simulate different surgical approaches on this same digital spine. The system predicts outcomes for each approach by matching the post-surgery virtual spine against historical data.
.jpeg)
For example, imagine a patient with moderate scoliosis. The surgeon creates a surgical simulation that virtually performs three different procedures: traditional spinal fusion at four levels, a less invasive fusion at two levels, or a dynamic stabilization system. For each virtual surgery, the system modifies the voxel array to reflect the surgical changes, then matches this modified pattern against thousands of real patient outcomes.
As shown in the visualization above, each surgical option produces different predicted outcomes. The surgeon receives predictions for each approach: pain reduction likelihood, mobility preservation, complication risks, and long-term success rates—all personalized to this specific patient's proportional spine characteristics. This analysis happens in seconds rather than years, costs thousands rather than millions, and requires no patients to undergo experimental procedures.
The Future Is Here
Proportional Array Voxel Matching transforms medical imaging from a diagnostic tool into a predictive powerhouse. Those thousands of MRI scans sitting in hospital databases finally become connected sources of wisdom rather than isolated data points. Every past patient contributes to better outcomes for future patients.
For patients facing spine surgery, this means decisions based on evidence from people with spines like theirs, not just general population statistics. For surgeons, it means confidence that comes from seeing relevant outcomes before making the first incision. For healthcare systems, it means better results without endless clinical trials.
The technology turns the challenge of too much data into the solution of better prediction.